
Nike Stock at $95 is a Buy!
A+ Setup on Nike Stock, a buy off weekly support.

Weekly Chart
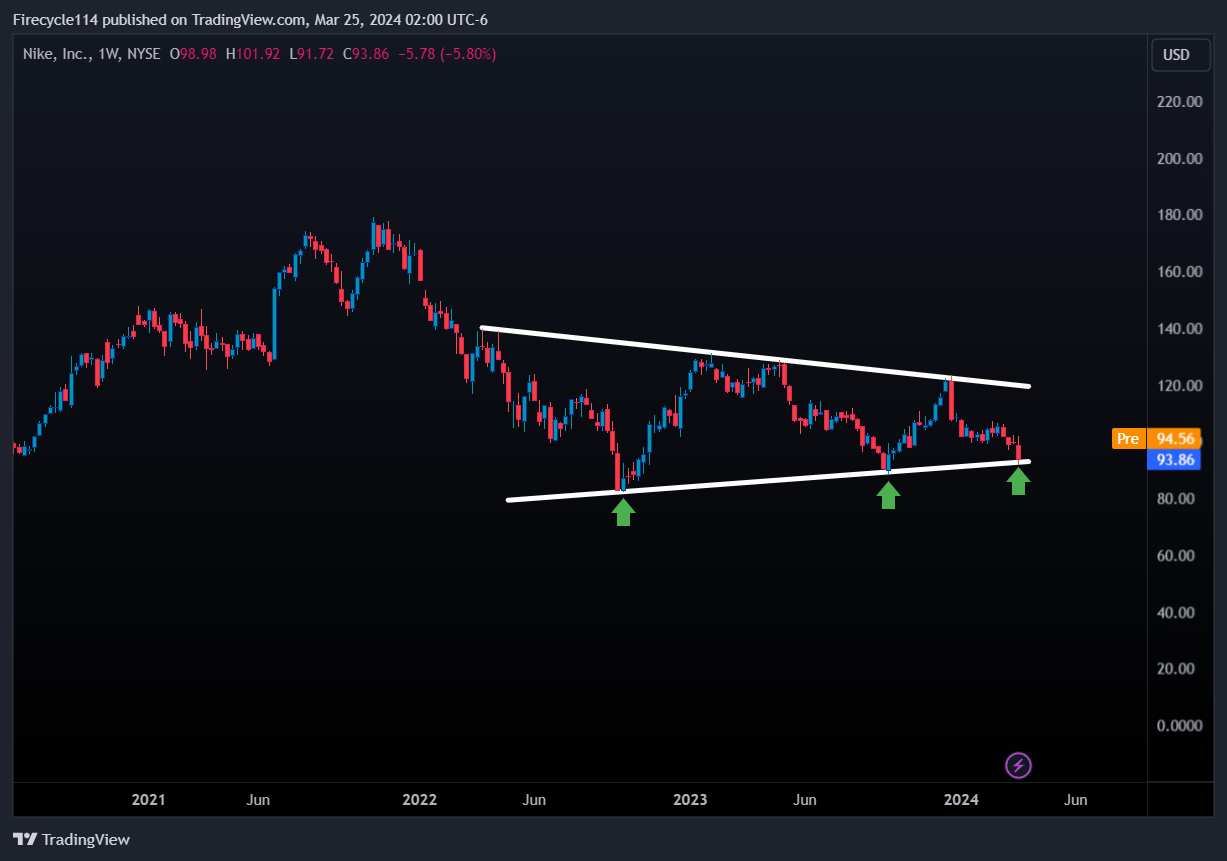
NKE 0.00%↑ hit a all time high of $178 in 2021 and has now been consolidating and trading sideways for more than a year now. We have a symmetrical triangle formation and have hit a critical level of support. The stock is sitting at a daily and weekly support. The trade plan is to buy low and sell high. Buy the low off the support and play the bounce to the resistance price target $120+. Stop loss close below the support on the weekly timeframe.
Daily Chart
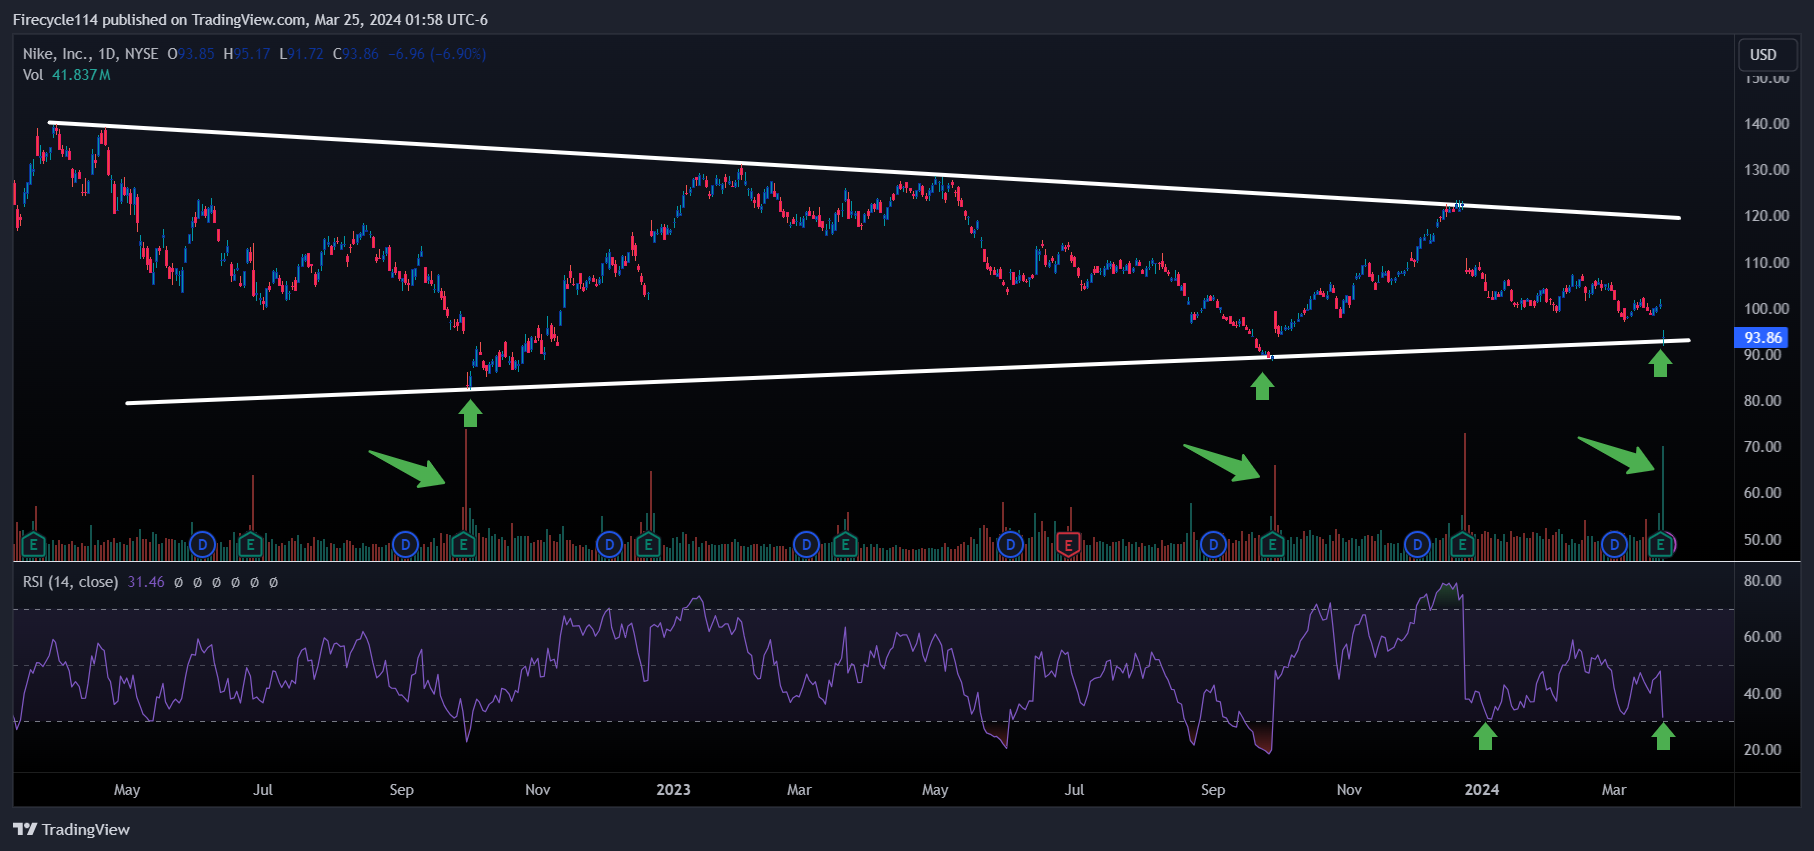
RSI is a indicator that tells us if a stock is overbought or oversold and it has given us a oversold alert. There is also a huge volume spike. Huge volume spike means a increase in trading activity especially because of it’s earnings report. NKE 0.00%↑ is a blue chip stock which means we have a higher probability that we follow through with this setup since we got a lot of eyes on this stock.
Earnings
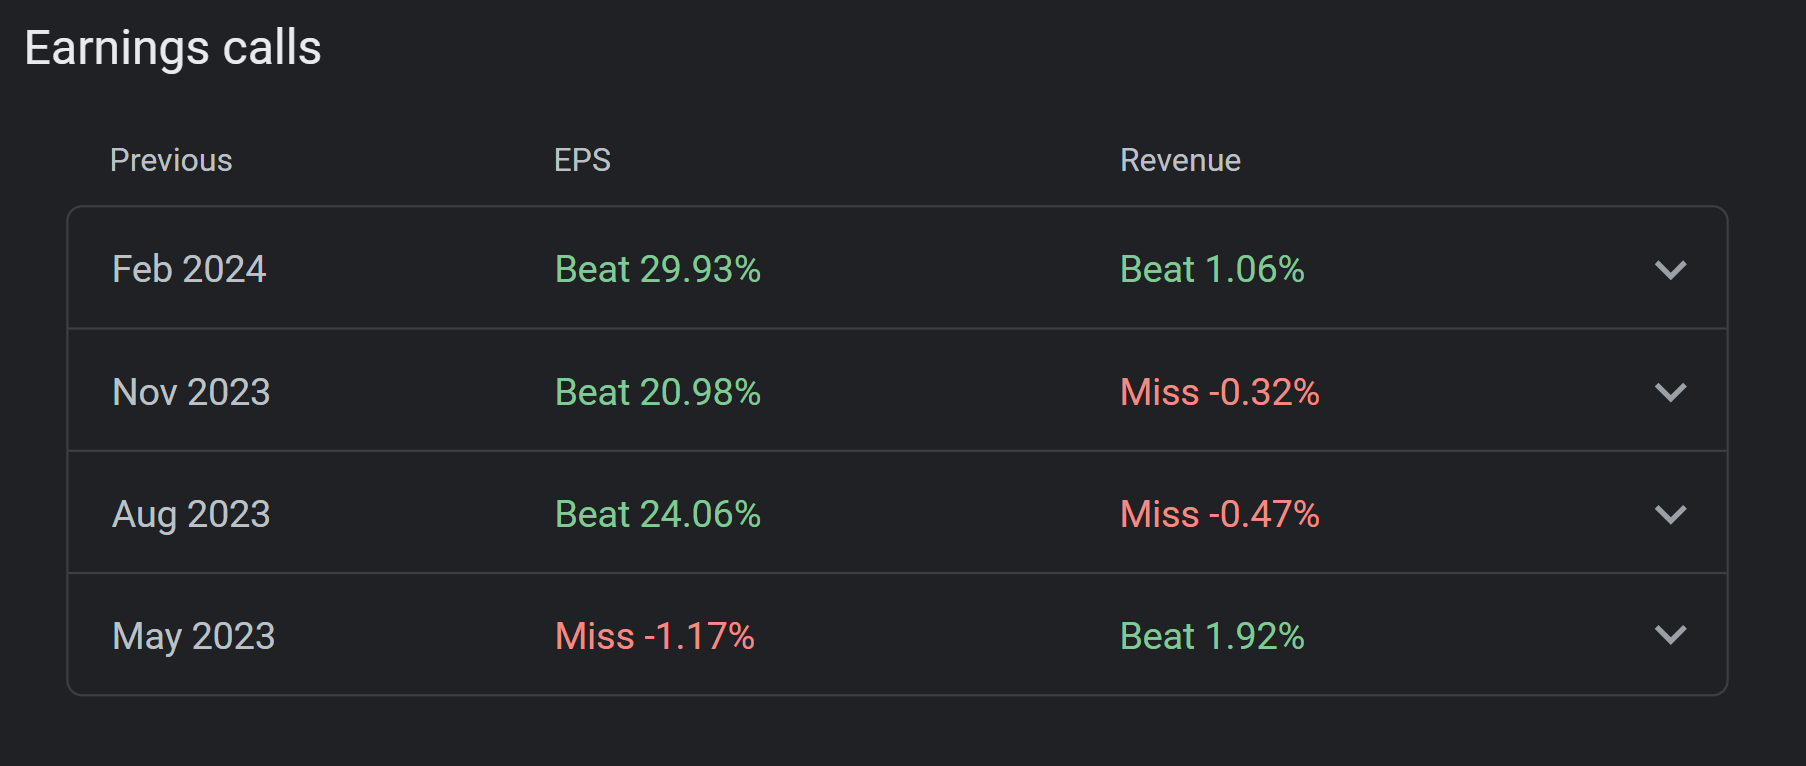
The reason why Nike stock dropped and hit this level of support is because of it’s earnings report that got released last week. We got headlines of Nike declining sales in China. A perfect opportunity to buy the dip on for Nike Stock!